Stats With Context: 10-Game Check
Mavericks at .500—are there signs of a turnaround?
With the first 10 games under their belt, the Mavericks have shown some frustrating, intriguing, and hopefully positive trends worth unpacking.
Throughout the season, I’ll try to check in with these Stats With Context breakdowns every 10 games or at other critical points, like the trade deadline, to track meaningful shifts.
Ten games is a solid sample size—big enough to spot emerging patterns, though far from definitive. Typically, the picture sharpens by the 20-game mark, and as Mavericks coach Jason Kidd often mentions, Christmas is when he does his first real evaluation of the team.
You’ve seen glimpses of the Mavs' and their opponents' offensive and defensive ratings in each game preview, along with my 4-Factors rankings, so it’s interesting to track how these evolve.
But stats alone don’t tell the story; that’s why I’ll add context (hence the Stats With Context title) to each stat or chart, pulling insights from what we’ve seen game-by-game in our observations.
NOTE: I use Cleaning the Glass data for most of my team rankings and player stats in this article.
Stat No. 1 - Overall point differential and four factors rankings
Context: The Mavericks rank 7th in the NBA in point differential and are in the top 10 for both offense and defense, yet their record stands at just 5-5, placing them 11th in the West. So, where’s the catch?
The biggest factor is their 1-4 clutch record. Dallas has played several close games against strong teams but has only won one of them. Based on their point differential, Cleaning the Glass projects them at 7 expected wins—and a 7-3 record that would make their standings position feel much more bearable.
Many analytics experts will tell you that clutch record is largely noise. For example, the Mavericks ranked as the 2nd-best team in the NBA last year with a 23-9 clutch record. This season, the Suns are 7-1 in clutch games, yet they were only 20-21 last year. While the process in many of these close games has been concerning, I believe things will eventually regress to the mean for the Mavericks.
Stat No. 2 - Offense started slow but is picking up
Context: As you can see from the chart, the Mavericks' offense is trending in the right direction. Dallas had four strong offensive performances in the last five games, going toe-to-toe with three high-powered offensive teams—the Pacers, Suns, and Nuggets. Kyrie Irving is playing and shooting at a very high level.
A less positive trend? The Mavericks' shot profile is still very un-Mavericks-like.
For the first time in the Dončić era, the Mavericks are not in the top 5 for three-point frequency: they rank 17th at the moment and 15th in corner three frequency after breaking NBA records in that category over the last couple of seasons.
In the first 10 games, they've replaced many of the threes with mid-range shots. You could argue some of this is positive, considering no Maverick other than Kyrie Irving is shooting better than 35 percent from three. But this isn’t the high-octane, high-volume three-point offense we envisioned when Klay Thompson came on board.
I believe the reason for the Mavericks' changed shot profile is closely tied to Dončić’s uncharacteristic early shooting struggles, which brings me to the next point.
Stat No. 3 - However the main engine is still not in full gear
Context: We’re used to seeing Dončić’s three-point shooting fluctuate between 30 and 40 percent throughout his career, both in regular season stretches and playoff series. The mid-range shot has been his bread and butter, and, as you can see in the tables above, he’s consistently ranked in the top 90th to 100th percentile in floaters and short mid-range shots.
For whatever reason (a topic for separate analysis), those shots in the paint and around the elbows aren’t falling early this season. And I believe it’s not only affecting Dončić’s efficiency (and, consequently, the Mavericks' overall efficiency, as he is by far their highest-usage player), but it’s also impacting the shot profile mentioned in the previous point. Dončić, who has consistently been one of the most double-teamed players in the league, is seeing the fewest blitzes on his pick-and-rolls since his rookie year. With his finishing in the paint not at its usual deadly efficiency, teams are largely willing to live with that and send less help. Less help means fewer rotations, which translates to fewer corner and other three-point opportunities for his teammates.
If I had to bet, I’d put my money on Dončić turning this trend around soon. We have a large sample from the last four seasons showing him as one of the best finishers in the short mid-range. But this is the trend that has left the biggest mark and had the most significant impact on the first 10 games.
Stat No. 4 - Defense was reminiscent of last year's post-deadline until the injuries hit
Context: Looking at the defensive rating trend per game, you’ll see that the Mavericks had several strong defensive performances before some of their best defenders—Dereck Lively II, P.J. Washington, and Maxi Kleber—were sidelined by injuries. Since then, the Mavericks have been drawn into high-scoring contests (IND, PHX, DEN) and lost all of them, despite their offense performing at a high level.
Without Lively and Washington, the Mavericks’ paint protection spiraled downward, and rebounding issues emerged in key moments of clutch games. However, what we saw before the injuries was reminiscent of last year's paint-walling defense that was the foundation of the Mavericks’ Finals run. I’d still like to see this defense, at full strength, tested against teams with good shooting bigs like Boston and Indiana to gauge its ceiling. But the floor was pretty clear early on, as the Mavericks’ defense clamped down on bad and average teams with exploitable weak links.
Stat No. 5 - No stops, no pace
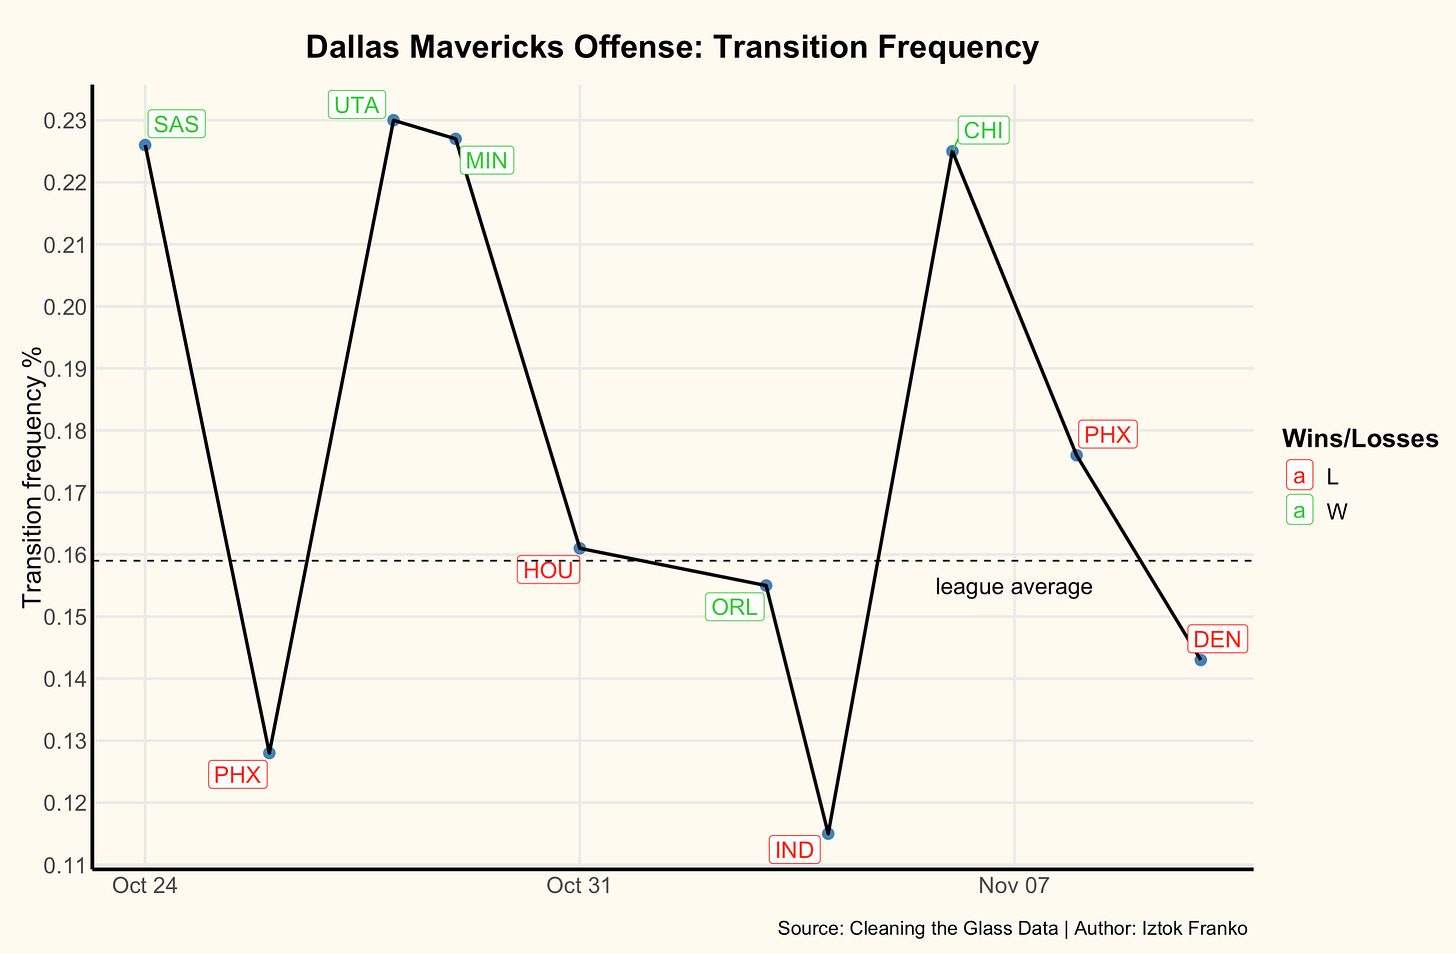
Context: Another statistical pattern that stands out from the first ten games—and is connected to the previous point—is the Mavericks’ pace of play. Last year marked a major transformation, as we saw the Mavericks shift from one of the slowest teams to one playing at a much faster pace (Dallas ranked 7th in pace last season). This season, the Mavericks have won games where they managed to get stops and run. As you can see above, in all of their wins—except the one against the Magic—the Mavericks had a transition frequency above 20 percent. This is yet another reason to believe the floor for this team should be fairly high once the defensive backbone is restored with Lively and Washington’s return.
Bonus stat: What about three-point shooting luck?
Context: I mentioned the Mavericks' poor three-point shooting during the first 10 games. At 35.6 percent overall, Dallas ranks 19th in three-point accuracy and 21st in corner three-point percentage. What about their opponents?
Overall, Dallas has been fairly lucky, ranking 9th in opponent three-point accuracy at 34.6 percent. So far, opponents have shot just 33.0 percent from the corners against Dallas, which is somewhat concerning given that the Mavericks allow plenty of these shots—though some of this is by design within their defensive scheme. However, as you can see from the trend chart, in their recent three losses against Indiana, Phoenix, and Denver, the "luck" trend reversed.
It’ll be interesting to see if the expected improvements for Dallas—such as Dončić’s shooting, the Mavericks’ shot profile with a higher three-point volume, and enhancements in defense and rebounding with Lively and Washington’s return—start to materialize over the next 10 games, when we’ll do another snapshot.
Until then, that’s it for the first Stats With Context check. Let me know what you think, or if there’s any other area you’d like me to examine or share.


Hey Iztok, thnx for this observations. Keep the good work. I cant wait to read your thoughts about every game. Is there any stat of the in and out shots - unlucky bounces. My thoughts are, that in the previus games were a lot of them( esp.Thompson). Bearing in mind that last few games were very close it could be a big factor.
Great read boss